One of the things I loved about working at Loon was that we pulled together experts from a wide range of disciplines, so I was constantly learning about things well outside my usual wheelhouse. One of the more unusual things I learned came from Rob, our resident atmospheric scientist, who introduced us to the Quasi-Biennial Oscillation (or QBO). Here’s the story:
Until modern times little was known about winds in the stratosphere because it’s too dry up there for cloud formation, but a rare opportunity came in 1883 when Krakatoa erupted with so much force that ash was thrown as high as 20 miles up. Over the next few weeks the high-altitude ash caused brilliant sunsets around the globe, and by tracking when these sunsets occurred scientists were able to determine that high-altitude winds around the equator were easterlies (i.e. coming from the east), and were a nearly hurricane speed of 65-70 mph. These winds were appropriately called the Krakatoa Easterlies.
Some 20 years later scientists started launching weather balloons and noticed that at least some of them showed winds to be westerlies, but the consensus view remained that stratospheric winds around the equator were mostly easterlies with the occasional westerly layer. It wasn’t until the 1950s that we started sending up daily sounding balloons and realized something much stranger was going on. The winds weren’t easterlies or westerlies — they were actually a stack of alternating winds that slowly descended like a barbershop pole at a rate of about 1 km per month. What’s even weirder is that the altitude where direction shifts follows a pattern that’s regular but not seasonal or annual. At first scientists thought it was bi-annual, but even that turned out to be wrong: it’s quasi-biannual, with a period of about 28 months. The stack also favors easterlies in the upper stratosphere and westerlies in the lower stratosphere, with westerlies dominating the lower altitudes for about 20 of the 28 months. In spite of being incredibly regular it wasn’t until just the past decade or so that scientists have finally able to explain the phenomenon to the point where it can be modeled.
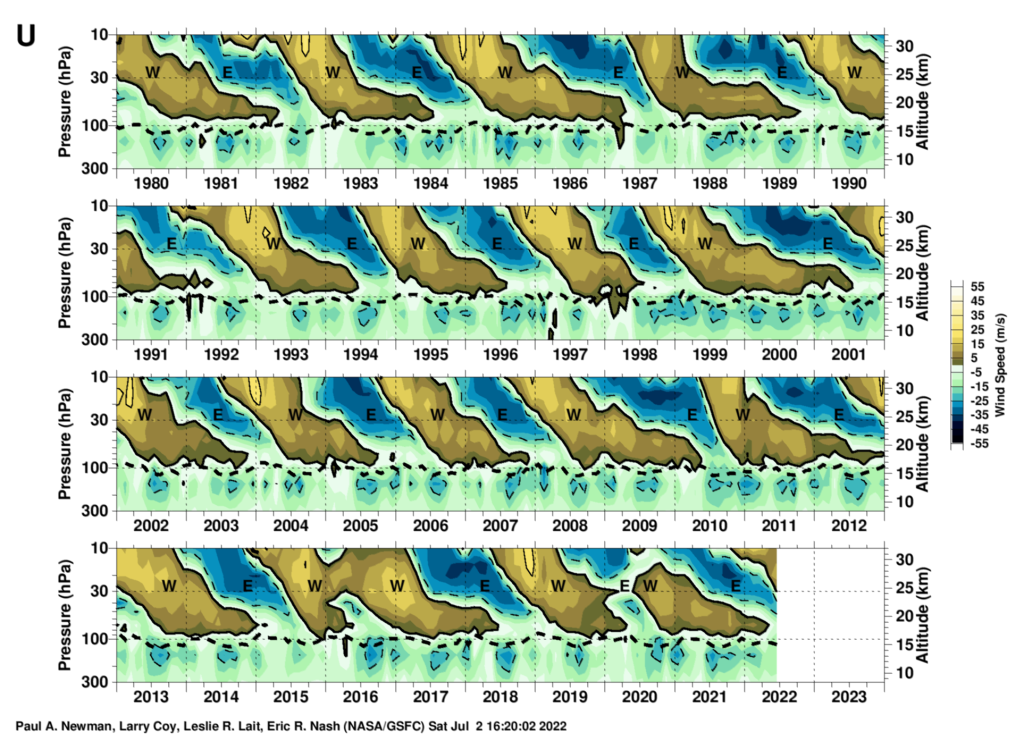
Credit: NASA (https://acd-ext.gsfc.nasa.gov/Data_services/met/qbo/qbo.html)
The QBO was really important to Loon for two reasons. The first was maneuverability: Loon balloons maneuvered by catching winds at different altitudes in a range of roughly 110 to 55 hPa (15.5 to 20 km), which spans both the top of the tropopause and the bottom of the QBO. Since the top of the tropopause tends towards easterlies year-round, whenever the bottom of the QBO was westerlies (about 70% of the time) it was likely that we could go back and forth across that boundary and effectively stay in one place! Yay station keeping! Of course for about 8 months out of 28 we’d likely need a lot more balloons to keep service over a region, so that made it important to predict when that switch was coming so we could plan accordingly.
The other reason was more of a surprise. In the early days of Loon we were launching most of our flights either in the US or New Zealand, but by early 2016 we had shifted our strategy and were testing in earnest around Peru. We had downloaded an archive of historical wind data from NOAA spanning from 1980 to 2015, but found that our flights were far out-performing our historical analysis. I’ll save the details for another day, but suffice to say that after about a month of digging through our simulation code to figure out what was going on we eventually concluded that stratospheric winds in the summer of 2016 was just plain wonky in a way that happened to be to our advantage — and that’s when Rob let us know that atmospheric scientists were sounding the alarm that for some reason the QBO pattern was being broken for the first time since measurements began in 1953! The pattern righted itself a few months later, but this one occurrence made us all the more wary of relying too much on historical data in this era of rapid climate change (and all the more interested in tracking the pattern to get early warning if it strayed again).